TOTAL QUALITY, CULTURE CHANGE and FACILITATION
Facilitation, Tools and Techniques
Facilitation
A facilitator needs to work at different levels.
At the level of the organisation they enable and develop the Total Quality process, identifying the actions to be taken and helping the organisation through the transition.
At the team level they can assist a team or work group by suggesting processes, helping them with tools and techniques, teaching the team members by example as they go. It is essential that they remain neutral at all times while facilitating teams.
The work in taking the organisation forward down a Total Quality route is described elsewhere. These pages concentrate on the tools and techniques used to support and make effective team decision making. A number of tools and techniques are listed but they do not represent the complete picture. The aim is to update and augment these pages with time.
Tools and Techniques
General
Before starting a facilitated session there should be some form of "contract" or agreement between the facilitator and the leader. Many advocate that this should be written but this is not necessary providing there is a clear understanding on the basic issues such as;
•the role of the leader
•the role of the facilitator
•the broad aims of the session (note these need to be checked with the group)
For facilitated sessions it is useful to breakdown the traditional barriers that exist between people. To assist with this it is often better to lay chairs out in an informal theatre style.
The main aim of the facilitator must be to remain neutral and ensure that there is the "buy-in" of all members of the group throughout the process. In order to ensure that the "buy-in" is there from the start it is necessarily to agree the common aims of the group and to agree to a process for meeting those aims before starting that process. This makes facilitated sessions appear to go slowly at the beginning but this apparent slowness will be compensated for as the group gets into its stride and the common goals and "buy-in" throughout ensures that they work as one.
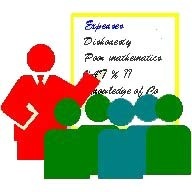
Brainstorming - useful for developing ideas
Brainstorming is a useful method for identifying a wide range of ideas to solve a problem. It involves the group calling out the ideas which should then be recorded onto a flip chart. All ideas should be recorded and the session should be as free flowing as possible. Sessions can last any time from a few minutes to hours depending on the difficulty and complexity of the problem. Often the best ideas can come when the session appears to be all but finished.
When the free flow appears to slow it is often useful if the facilitator suggests a different situation such as "What would a politician do if he had this problem" or "How would they solve it in the navy".
It is useful to post a set of rules at the beginning of the brainstorm. These should be agreed with all those taking part. A suggested set is as follows;
•No discussion of ideas
•Everyone to contribute
•Problem definition displayed
•Lots of ideas
•Positive encouraging atmosphere
•Allow time for thought
•Accept every idea no matter how crazy
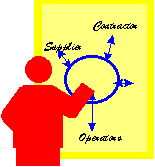
Conceptual Models - useful for understanding initial ideas
When a group comes together to investigate a possible way forward for the future its individual members often have clear ideas of how they would see the future mapped. It is important that each member of the group has an opportunity to express those ideas at an early stage so that all members of the group can recognise the basic paradigms behind the thinking of the others in the group. Often these conceptual models are quite different but are still complimentary and can be used as the basic building blocks of the final deliverable.
Conceptual models are best recorded as a mixture of graphics and words on a flip chart.
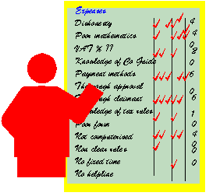
Ranking and Rating- used for analysis of data
Following a brainstorm it is often useful to analyse the list formed to determine priorities. There are a number of methods of undertaking this type of analysis.
Simple Tally
Each member of the group are given the chance to come to the sheets with the list of ideas and to place tally marks against (say) the top 5 items in their view. Items are prioritised according to the tally score. This is useful for its speed; it also has the benefit that group members need to get up out of their seats to write at the flip chart.
Weighted Tally
A slight variation on the above is the weighted tally. Each member of the group is asked to come to the front and score the ideas on the list from (say) five to one with five being their top score. The additional "gearing" has the effect of separating close scoring.
Consensus Marking
Where time is short, the list is long and the group is small. The members of the group can be asked to call out marking against (say) 1 to 10 for each item on the list. Providing the group is working well together an initial call may be challenged until a consensus is reached. The debate that ensures in reaching the consensus is often useful in increasing the understanding of the particular point.
The Multiplier Tally (or Consensus)
Often there are two criteria against which items need to be judged, for example "effectiveness" and " ease of implementation". Once again tally style scores are taken from each of the participants but this time it will be under each category. The two numbers are then multiplied to create the final priority list, although it is sometimes useful to also look at high scores under each of the criteria.
Force Field Analysis - useful for the analysis of the merits of apparently conflicting ideas
Simple Force Field
In its simplest form two ideas or solutions are written down either side of a line. The group is then asked to identify pressures that will move the line in either direction to either of the solutions. For example if the problem to be solved was inaccuracy in expense claims and one solution was to place them on computer while the other was a more complex paper form then the pressures may be as follows.
Towards the computer system;
Most errors are mathematical computer will resolve this
Computer system will check mileage to counter dishonesty
Computer system will check for level of expense against guidelines
VAT correctly accounted
User has previous expense claims to hand to check details
Towards the paper systems;
Some users still not familiar with computers
Paper system allows receipts to be submitted at the same time
If arrows are placed against the "forces" with their length approximately proportional to their effect then the picture of which is the best solution
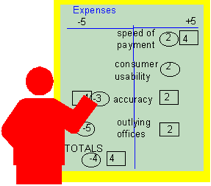
Neutral Statements Force Field
The Force Field analysis can be used to assess up to about 5 options using a variation. Each of the options is identified with a symbol and a series of neutral statements is determined by which the options can be judged. For the example above such statements may include speed of payment, consumer usability, system usability, accuracy, outlying office use. Marking judgements are usually developed by consensus with the group and the appearance for the two options above might be something like that shown below.
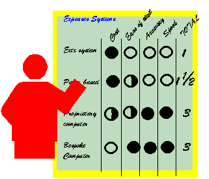
Black Ball Analysis - useful for comparing a number of options
For Black Ball analysis each of the options is given a name and are then listed down the side of a flip chart. The participants are then asked for the criteria against which they wish to judge the various options. The number of criteria should ideally be restricted to about 6 to make for a practical way forward. Each criteria is then taken in turn and the options discussed. If an option fully meets the specific criteria it is given a black ball. If it partially meets the specific criteria it is given a half black ball and if it generally does not meet the criteria it is given a white ball. A simple addition at the end yields the answer as to the best option while the overall pattern of balls on the flip chart can sometimes be used to identify areas where, for instance, all of the options are weak.
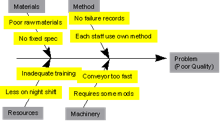
Cause and Effect Analysis and Solution Effect Analysis (Fishbone) - useful for determining the root cause of a problem or for analysis of potential solutions
This form of analysis can best be appreciated from a diagram.
The headings at the end of each arm need to reflect the nature of the problem. In cause and effect the team is looking at potential factors that may lead to the "effect" or problem. The solution / effect diagram is the same shape but works the other way round. At the head is the solution the team are looking for potential effects out on the arms. This is useful for testing whether there are likely to be any likely unwelcome side effects to a solution.
Fishbone diagrams can be used as part of the normal tool kit in meetings or workshops or alternatively they can be pinned to the wall and contributions sought on "Post-It-Notes"™ over a period of time.
Whichever system is used the result will be a series of categorised possibilities along the arms (or bones!). The next aim is to look for links between those possibilities to begin to understand the root causes in the case of cause and effect or possible unwanted effects in the case of solution effect.
Process Flow Diagrams - useful for determining a series of actions
Process flow diagrams outline in order the steps necessary to complete a task. It is not always easy to recognise all of the steps necessary and it is frequently necessary to use a variant of the brainstorm to collect a list of likely steps. Each member of the group is asked to write onto "Post-It-Notes"™ suggestions for the steps; these are collected and categorised before starting the diagram. The easiest way forward is to then ask for the first and last steps followed by the step nearest the middle. The gaps between these can then be looked at in a similar way by filling an item near the middle each time until the overall diagram takes shape.
Analysis at the end should endeavour to remove nay steps which cause a return backwards as these are where the inefficiencies are to be found.
With the addition of time and resource allocation process flow diagrams become a planning network. The What is Total Quality pages give examples of process flow diagrams in the section on Business Systems.